Methods
Overview
How the numbers on this site get made. Short version: a detector finds cyclists in the camera frames, I collapse those detections into distinct rider passages, and I type and give a direction to the frames that are clear enough. The steps are outlined in the flowchart below.
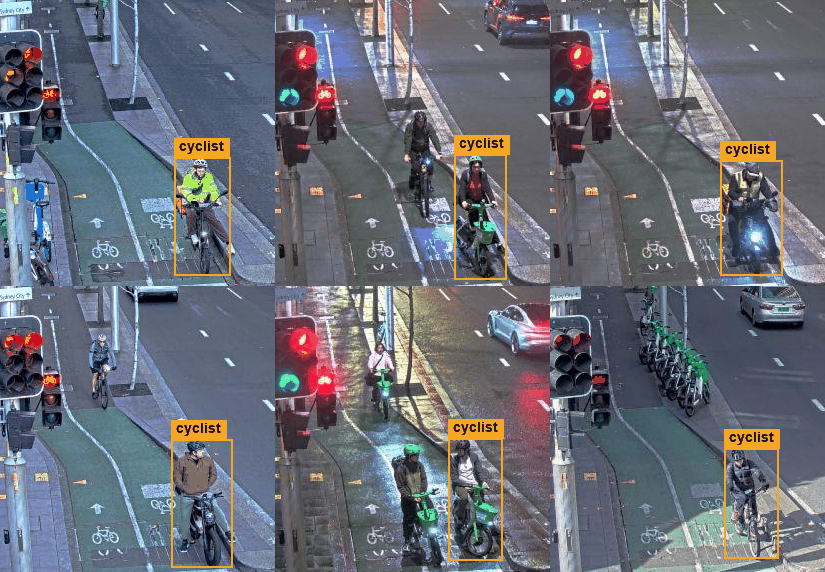
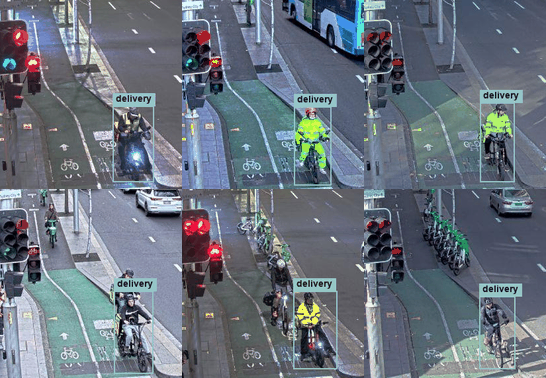
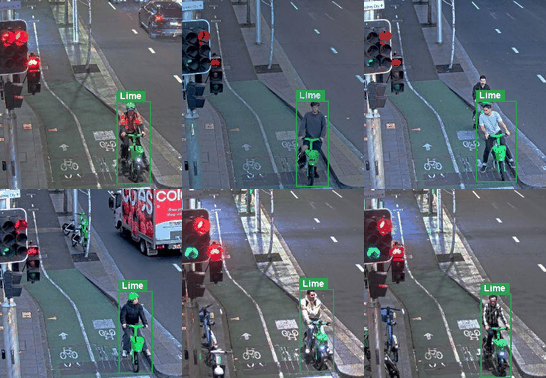
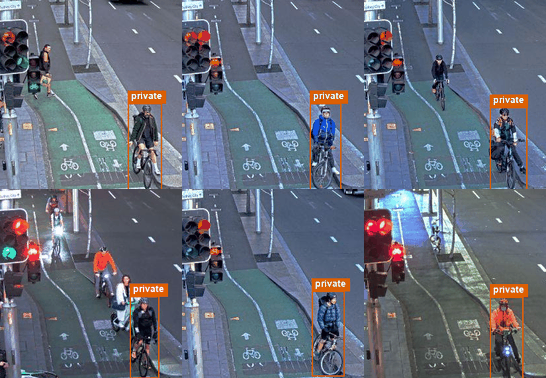
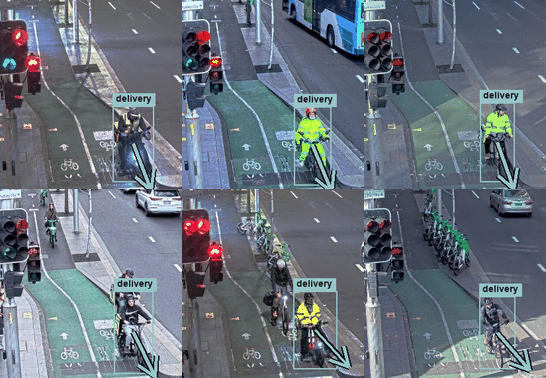
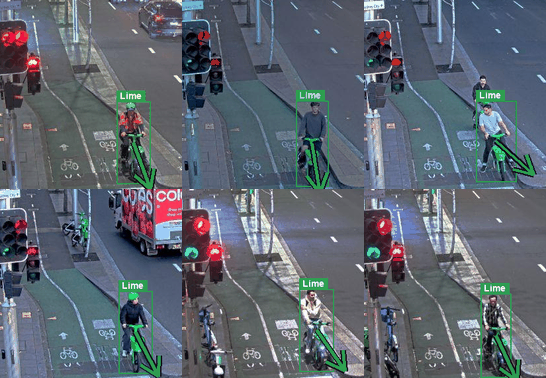
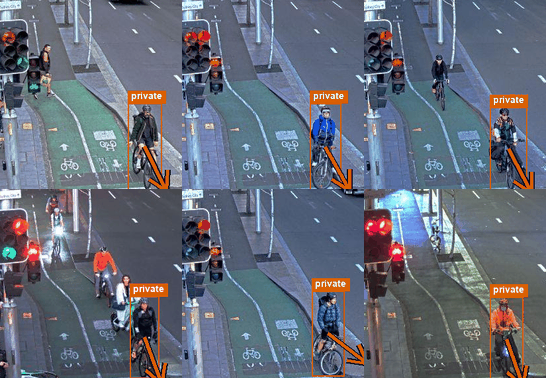
From a camera frame to a typed, directed rider passage. The rider clips are King St & Sussex St examples.
Data source
The images come from ten TfNSW live traffic cameras around inner Sydney:
- Kent Street
- King St & Sussex St
- Erskine Street
- Wentworth Avenue
- York St & Margaret St
- George St (Railway Square)
- Oxford St & Young St
- Alison Road (Randwick)
- Princes Highway (St Peters)
- Falcon Street (Crows Nest)
The images are © State of New South Wales (Transport for NSW), and used here solely for personal, non-commercial research.
Detection
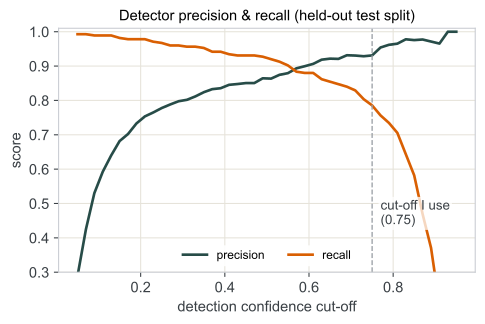
I find cyclists with a fine-tuned RF-DETR detector. COCO-pretrained models missed too much here, so I fine-tuned on ~2,000 hand-labelled cyclist boxes across the 10 cameras. It predicts one whole-rider box directly, with the confidence cut-off set high (0.75) to favour precision: held-out precision 0.93, recall 0.79. I favoured precision because false positives distort the composition estimates, whereas a missed rider just costs volume.
On the held-out test split, precision and recall trade off against the confidence threshold; 0.75 is where I run it.
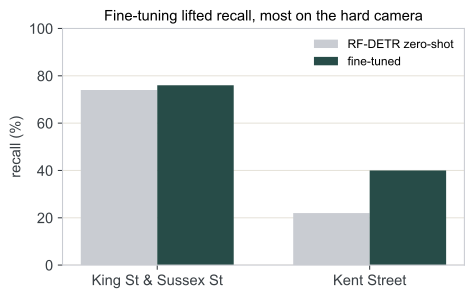
Fine-tuning made the biggest difference at Kent St, where the cyclists are far from the camera and appear only a few dozen pixels tall, so the off-the-shelf detector barely picked them out.
Rider passages
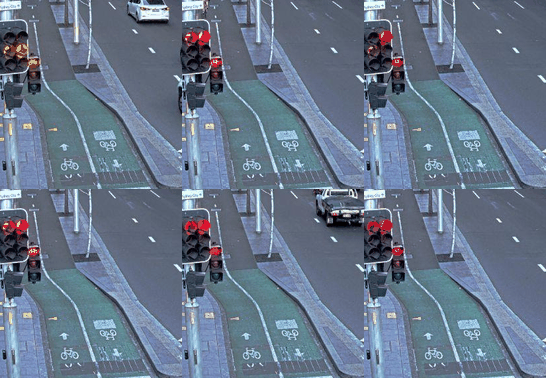
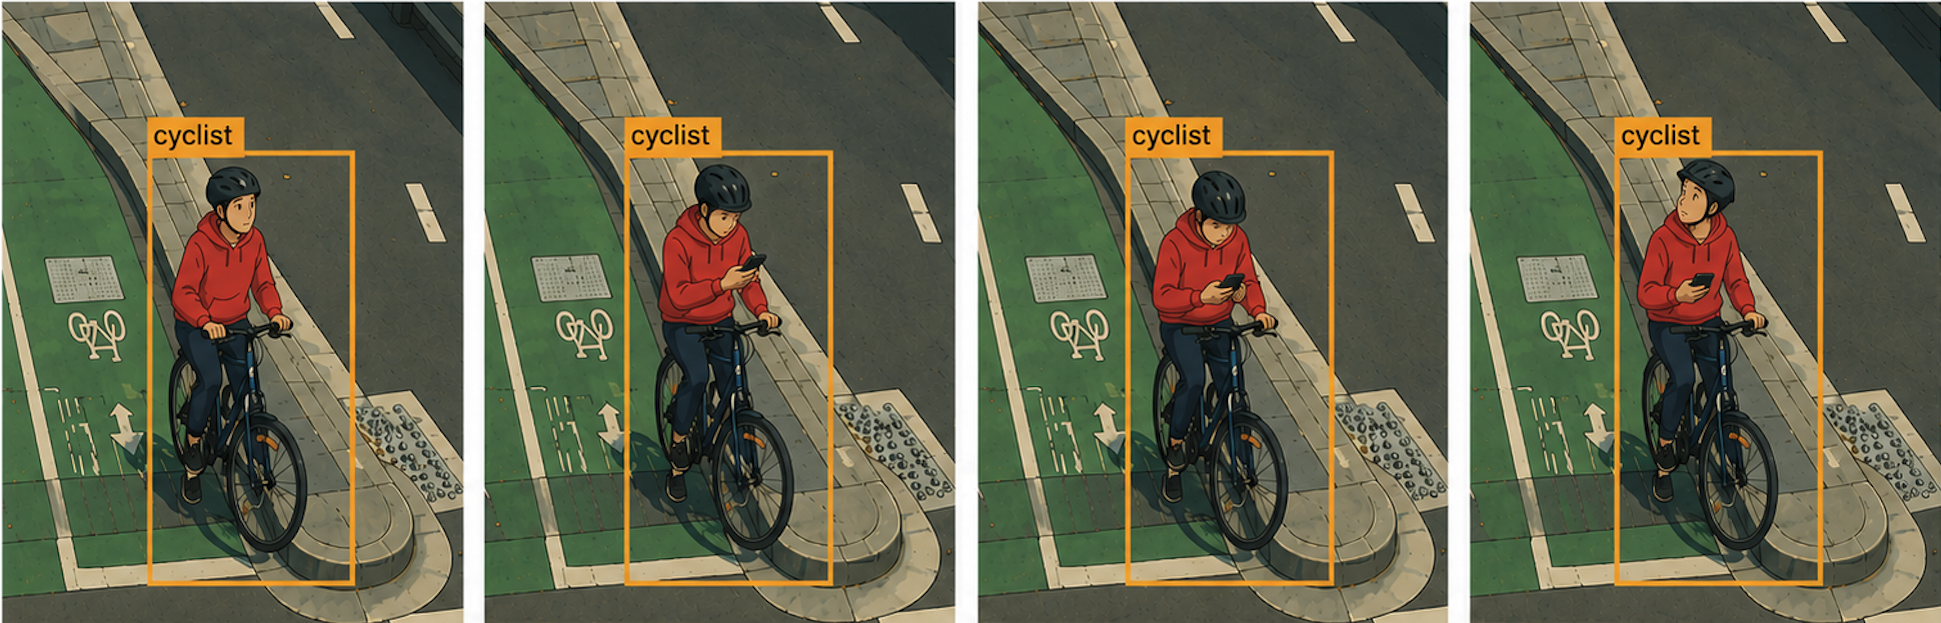
A cyclist waiting at a red light, such as might be seen at the King St or Kent St intersections, shows up in several frames in a row. Counting raw frame detections would over-count, so I collapse them into distinct passages by linking consecutive detections that overlap in space.
Here is one rider caught in four consecutive frames, collapsed to a single passage:
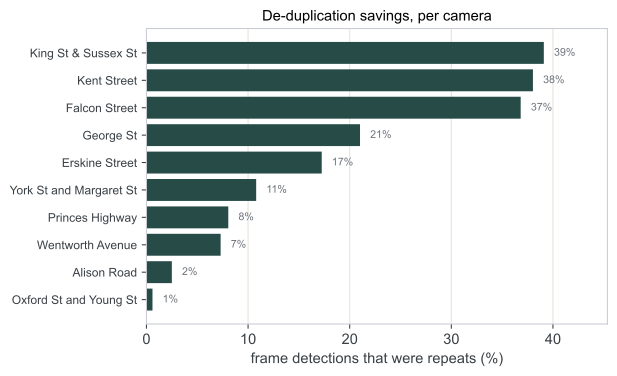
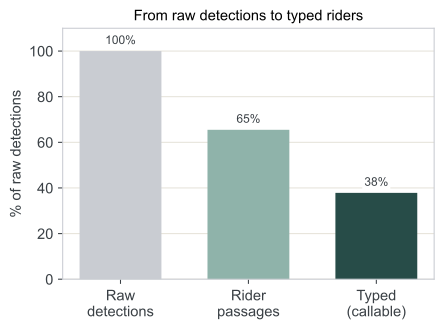
Collapsing the repeats shrinks the raw frame count into distinct passages, most at locations where cyclists often wait at the lights:
Callability
Most cyclists are too small or blurry to classify. Each cyclist is gated on rider size, sharpness, and whether the frame is greyscale (night infrared), so that the classifier only runs on crops big and sharp enough to judge. Only the King St and Kent St cameras have sufficient lighting and rider size + visibility for reliable classification, so I only report class composition for those two.
After collapsing raw detections into passages, about half of those can be typed; the rest stay unclassified.
Classification
For each passage I take its largest crop and type it with a frozen DINOv2 patch-token embedding fed to a class-balanced linear probe. The classes are mutually exclusive, resolved in order: delivery, then share (Lime), then private, then unclassified. Delivery wins over the bike underneath, so a courier on a Lime counts as delivery. So every callable rider lands in one class and the classes add up to the all-cyclists total.
On ~500 validation crops the probe never trained on, delivery is called reliably; private and genuinely-unclear riders are the harder calls.
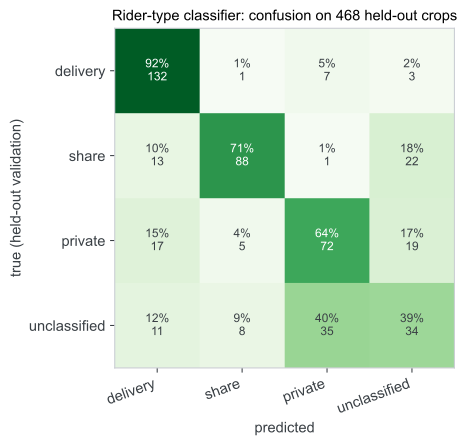
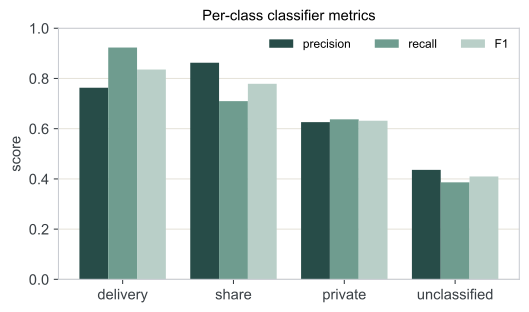
Delivery is the class the probe performs best on (92% recall). The bulky thermal food bag, carried on the rider’s back or strapped to the rack behind the seat, is a strong, distinctive visual cue. Lime is the next easiest, thanks to the bright green bike frame and basket, though about a fifth of true Lime riders still get abstained to unclassified and another tenth are called delivery. Cyclists on private bikes are harder because there’s no obvious cue like a bag or a colour to key on. The quantification step below corrects these rates in aggregate.
Direction of travel
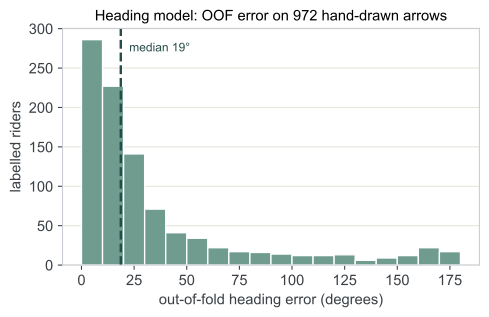
Each cyclist also gets a heading, from a DINOv2 sin/cos regressor, which is what the “which way they ride” arrow-flow is built from. To train it I drew the direction arrow by hand on ~1,000 riders. The model then predicts a heading for every rider.
Out-of-fold, the predicted heading lands within about 19° of the hand-drawn arrow for most riders.
Correcting the counts
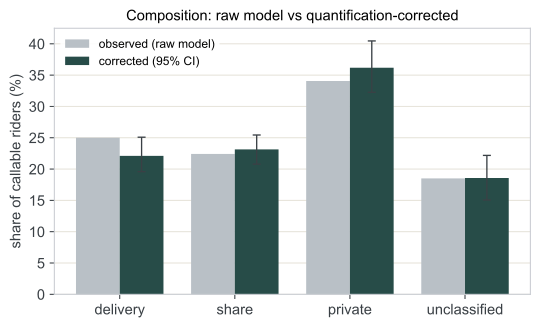
Quantification corrects the classifier’s per-crop errors into accurate group proportions: for each predicted class I estimate the mix of true classes it actually contains (from the held-out validation crops, split into day and night), then re-weight the observed counts by those rates. So the site’s numbers are the corrected proportions, not raw model output.
The 95% intervals below come from bootstrapping the validation labels: resample them 2,000 times, re-derive the rates, and take the 2.5th to 97.5th percentiles.
Limitations
This project only covers ten locations across inner Sydney, and of those, only two have reliable classification: King St and Kent St. At the other cameras the riders are too small in the frame to type. Viewing angle matters too, since a rider seen from behind is harder to classify than one facing the camera. And the share fleet here is effectively Lime only: HelloRide and Ario are out on the streets but turn up too rarely in this data to train on, which is something I hope to come back to.